X-ray Computed Tomography (CT) has emerged as a powerful, non-destructive scanning technique that can produce 3D rendering of the scanned object. It is a technique in which an incident x-ray beam passes through an object, and the beam is collected with an array of detectors. The object is rotated such that the x-ray beam probes from several angles to collect attenuation data and produce the equivalent of a cross-sectional “slice” through the region of interest. Recently, it was possible to acquire images of meso- or micro-scale properties of soil fabric using industrial x-ray CT systems, microfocus x-ray CT, combinations of optical, x-ray CT and magnetic resonance imaging and SMT.
The 3D Synchrotron Micro-Computed Tomography (SMT) facility produces intense, monochromatic, continuous, and highly collimated beams of hard x-ray with energy ranges from 10 eV to nearly 100 keV; hence, it is capable of yielding high-resolution 3D images. Throughout scanning, the x-ray beam strikes and penetrates the specimen. Some of the x-ray energy is attenuated by the specimen while other energy is transmitted through it. The transmitted x-ray beam is converted to a visible light by a scintillator and captured by a camera system. The light captured by the camera is an image projection of the specimen at one angle. In order to reconstruct a complete scan, several image projections of the sample were taken at different angles from, 0° to 180°. The following Figure shows a schematic of the SMT scanning setup.


Some of the Related Publications:
- Cil, M. B. and Alshibli, K. (2014). “3D Evolution of Sand Fracture Under 1D Compression”, Geotechnique, Vol. 64, No. 5, pp. 351-364, http://www.icevirtuallibrary.com/doi/10.1680/geot.13.P.119
- Cil, M. B. and Alshibli, K. A. (2014) “3D Analysis of Kinematic Behavior of Granular Materials in Triaxial Testing Using DEM with Flexible Membrane Boundary”, Acta Geotechnica, Vol. 9, No. 2, pp. 287-298, http://link.springer.com/article/10.1007%2Fs11440-013-0273-0
- Hasan, A. and Alshibli, K. A. (2012) “Three Dimensional Fabric Evolution of Sheared Sand”, Granular Matter, Vol. 14, No. 4, pp. 469-482 DOI: http://dx.doi.org/10.1007/s10035-012-0353-0
- Hasan, A. and Alshibli, K. A. (2010) “Experimental Assessment of 3D Particle-to-Particle Interaction within Sheared Sand using Synchrotron Microtomography”, Geotechnique, Vol. 60, No. 5, pp. 369-379, DOI: http://dx.doi.org/10.1680/geot.2010.60.5.369
- Alshibli, K. A. and Hasan, A. (2008) “Spatial Variation of Void Ratio and Shear Band Thickness in Sand Using X-ray Computed Tomography”, Geotechnique, Vol. 58, No. 4, pp. 249-257, DOI: http://dx.doi.org/10.1680/geot.2008.58.4.249
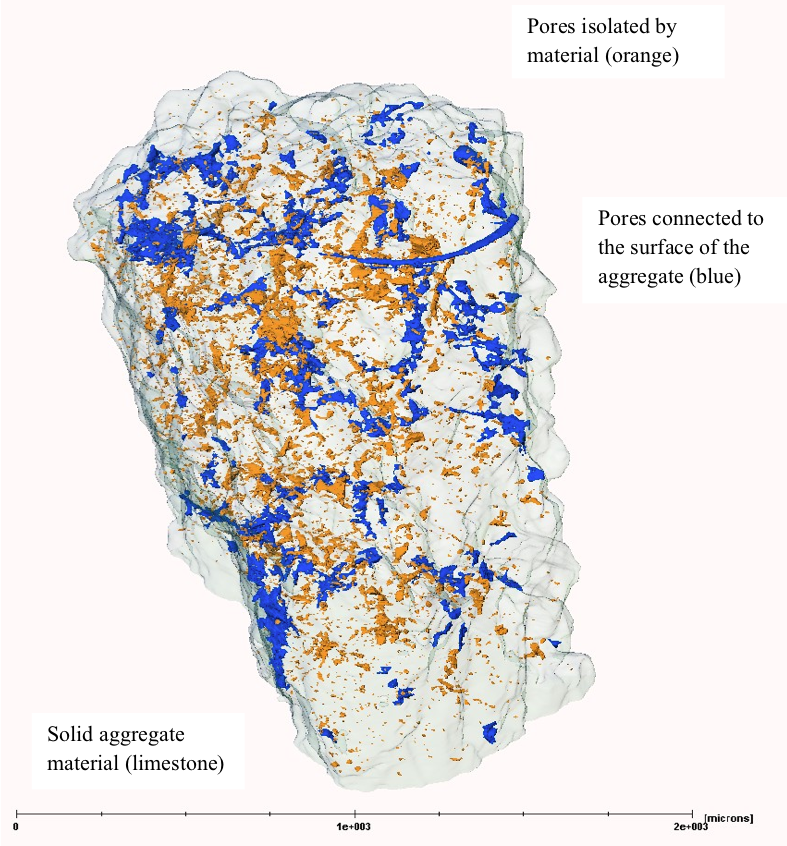
- Alshibli, K.A., Alramahi, B., and Attia, A. M. (2006) “Assessment of Spatial Distribution of Porosity in Synthetic Quartz Cores Using Microfocus Computed Tomography (µCT)”, Particulate Science and Technology: An International Journal, Vol. 24, No. 4., pp. 369-380, DOI: http://dx.doi.org/10.1080/02726350600934606
- Alshibli, K.A. and Alramahi, B. (2006) “Microscopic Evaluation of Strain Distribution in Granular Materials during Shear”, ASCE, Journal of Geotechnical & Geoenvironmental Engineering, Vol. 132, No. 1, pp. 80-91, DOI: http://dx.doi.org/10.1061/(ASCE)1090-0241(2006)132:1(80)
- Al-Raoush, R. and Alshibli, K. A (2006) “Distribution of Local Void Ratio in Porous Media Systems from 3D X-ray Micro-tomography Images” Physica A: Statistical Mechanics and its Applications, Vol. 361 (March), No. 2, pp. 441-456, DOI: http://dx.doi.org/10.1016/j.physa.2005.05.043
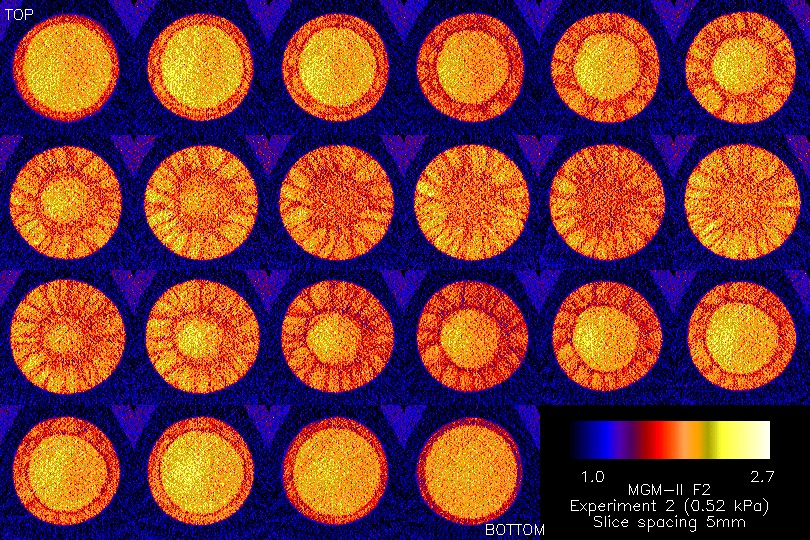
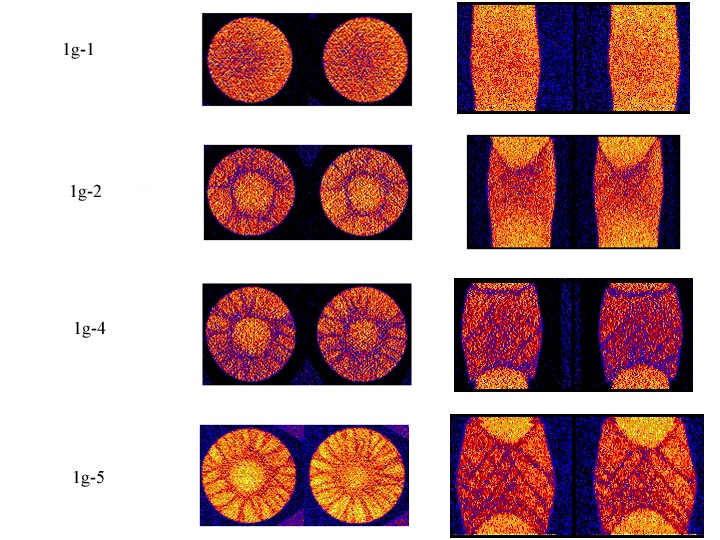
- Batiste, S. N., Alshibli, K. A., Sture, S., and Lankton, M. (2004) “Shear Band Characterization of Triaxial Sand Specimens Using Computed Tomography” ASTM, Geotechnical Testing Journal, Vol. 27, No. 6, pp. 568-579, DOI: http://dx.doi.org/10.1520/GTJ12080
- Alshibli, K. A., Sture, S., Costes, N. C., Frank, M., Lankton, M., Batiste, S., and Swanson, R. (2000) “Assessment of Localized Deformations in Sand Using x-ray Computed Tomography”, ASTM Geotechnical Testing Journal, Vol. 23, No. 3, pp. 274-299, DOI: http://dx.doi.org/ 10.1520/GTJ11051J