Three-dimensional x-ray diffraction (3DXRD) microscopy is a promising technique that has the potential to measure lattice strains and crystallographic orientation of crystalline materials. It is based on transmission geometry that can be applied in both layered and bulk materials It allows nondestructive 3D mapping of polycrystalline materials and monitors in situ dynamic processes of the bulk specimens. It also permits structural characterization of individual grains embedded in polycrystals. The volume, strain, phase, and orientation of hundreds of grains/particles can be monitored simultaneously. 3DXRD represents a new opportunity to directly acquire information about the interaction of individual particles. Current applications of 3DXRD focus primarily on polycrystalline metals. Poulsen (2004) introduced 3DXRD technique and its potential applications in materials science. Martins et al. [29] measured the elastic strains of individual aluminum grains as a function of tensile load. Jensen et al. (2004) demonstrated that 3DXRD could be used to monitor recrystallization in metallurgical processes, grain migration during recrystallization, solid-state nucleation, and grain growth during phase transformations. Hall et al. (2011) presented preliminary results of 3DXRD scanning on Ottawa sand specimens that were subjected to 1D loading. However, their analysis did not include extracting lattice strain tensor measurements from the data.
PRINCIPLE OF 3DXRD MICROSCOPY
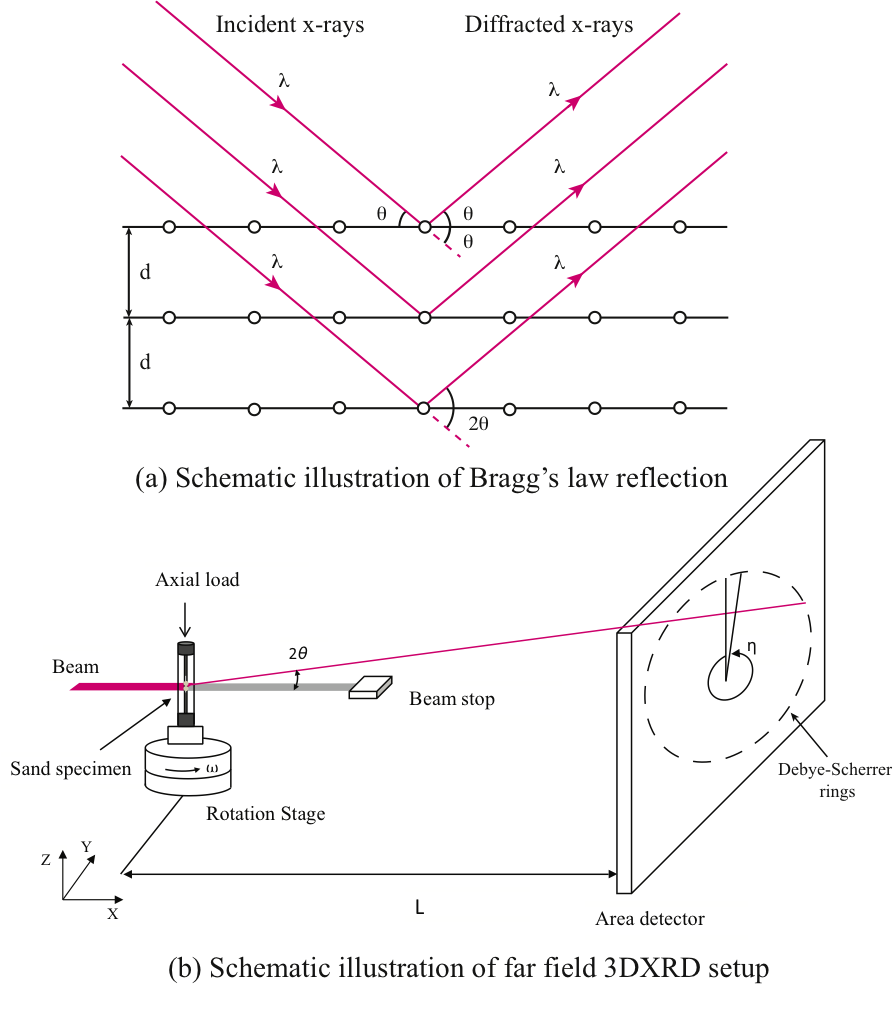
The incident monochromatic synchrotron x-ray beam is scattered on the orderly arranged atoms of a crystalline material (Figure 1). The diffracted x-ray beams obey Bragg’s law:

where λ is the wavelength of the incident beam, θhkl is the angle of the incident beam to the lattice planes with distance of dhkl. The subscript hkl denotes the lattice planes (hkl) with Miller indices of h, k, and l. Accordingly, the diffracted beams can be observed only in the directions that fulfill the Bragg condition (Eq. 1) and constructive interference can be obtained as defined by selection rules on Miller indices according to the crystal symmetries and atomic form factors. A simple visual interpretation of the diffraction geometry is shown below, where the incident x-ray beams are reflected on the set of lattice planes (hkl) like on a mirror, and the angle of the diffracted beam to the incident beam is 2θhkl. Thus, the diffracted peak positions from a powder-like sample are located on the Debye-Scherrer rings. The knowledge of wavelength λ, and the measurement of the diffraction angle 2θhkl provide information about the lattice spacing dhkl, which is in direct correspondence with the lattice strain projected to the normal of the given lattice planes. A family of parallel lattice planes with spacing dhkl is described by a reciprocal lattice vector, later referred to as g-vector. As the applied compressive stress increases, the crystal gets distorted, and the lattice spacings (g-vectors) change according to the constitutive response of the material.
EXPERIMENTS
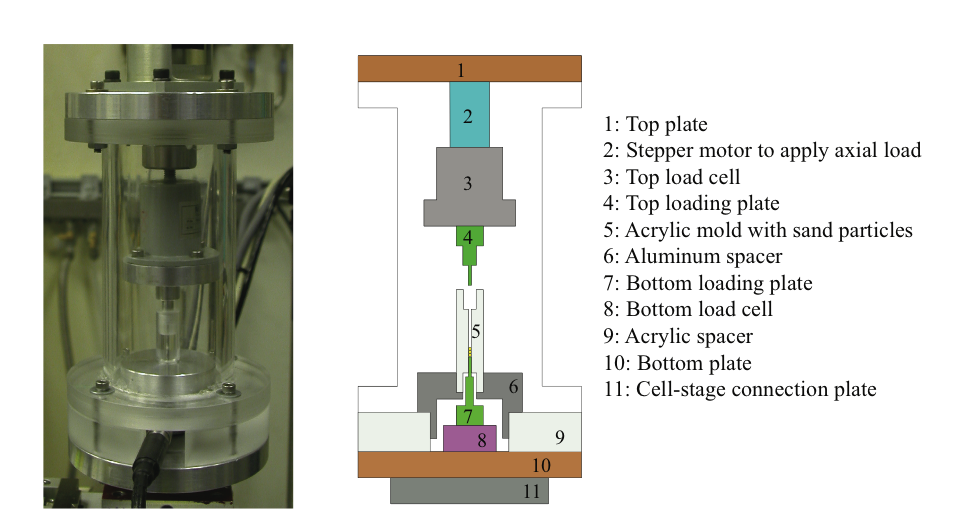
The sand used in the experiments is natural uniform silica sand known as ASTM 20-30 Ottawa sand with particle size between 0.595 mm (Sieve No. 30) and 0.841 mm (Sieve No. 20). It was mined from Ottawa, Illinois, USA. A special test cell was fabricated to conduct the experiments. Three sand particles were placed inside a 1 mm cylindrical hole at the center of a 15 mm acrylic cylindrical mold (Figure 2). The load was measured at the top and the bottom end plates using two load cells. The bottom load cell was attached to the aluminum base plate of the cell. An acrylic spacer was used to hold the cylindrical mold that contained the sand particles. The load of particles on the bottom load plate was transmitted through tungsten carbide rod with a diameter of 0.8 mm and a height of 12.7 mm. The acrylic mold was placed on the top of the bottom loading plate extension without any friction between them. Then, three particles were placed inside the mold using a special aluminum funnel with 1 mm diameter.
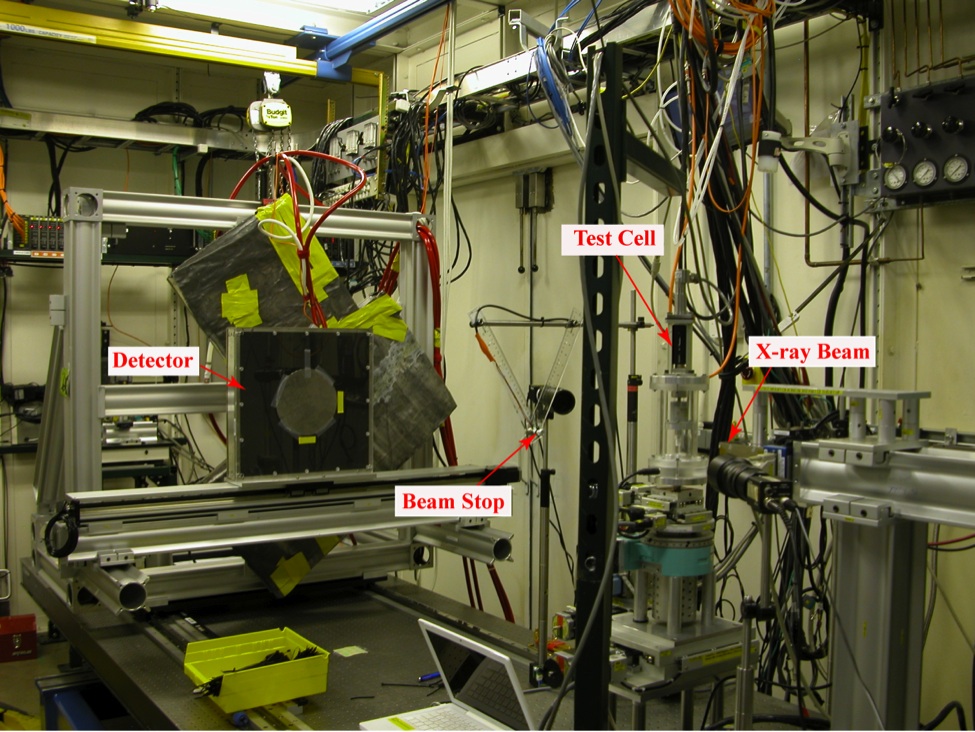
The test cell was mounted on the sample stage of beamline 1-ID at APS (Figure 3). The specimen was subjected to axial loading at a constant displacement rate using a computerized stepper motor. The sand particles were illuminated by a high-energy x-ray beam with a size of 0.8 mm x 1.0 mm and an energy of 80.725 keV that corresponds to wavelength of 0.15358 �. Diffraction data were detected by an area detector that was positioned at a horizontal distance of 1593 mm (L in Figure 1b) from the specimen.
RESULTS
The scanning dataset represents a map of the 3D reciprocal space distribution of the investigated particle. Figure 4 depicts an example image of the diffraction data. The discrete peaks appeared at the location predicted by the Bragg condition as expected, and no significant overlap of the measured spots was observed. Figure 4 clearly demonstrates the behavior of the spots under the effect of progressive loading. Reflections appear and disappear at specific η, ω, and 2θ positions as extended spots according to the imperfections and defects of the crystals. The deformation leads to displacement of spots on the detector according to the particle rotation and lattice distortion. Therefore, reflections may move through {η, ω, 2θ} space during the deformation process.
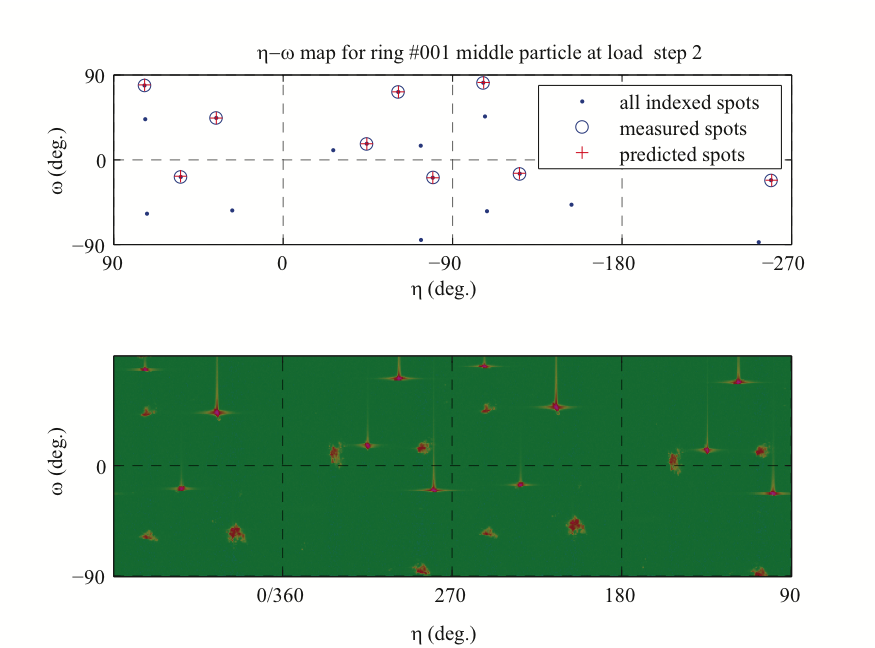
As an example, Figure 5 provides η-ω maps of the center layer of the sand column. The images represent the measured diffraction spots recorded in the first Debye-Scherrer ring with 2θ{100} = 2.07° at selected load steps. Before particle fracture, a significant orientation change or particle rotation occurs, then the particle disintegrates into several small fragments. These images show that the deformation causes certain changes in the structure of sand particles.


Strain calculations were performed using a MATLAB script developed by the authors. The ideal g-vectors before loading were determined as the reference condition based on the lattice constants obtained from the powder diffraction. The change in the diffraction vectors in each load increment was determined by normalizing measurements with respect to the initial, strain-free, condition. 3DXRD data were collected for three similar uniaxial compression experiments and were used to calculate the lattice strain tensors of individual sand particles. The experimental configuration and parameters were kept the same in the three tests with exception of the loading rate. The results of the three experiments are similar to each other.
The grain averaged strain tensor (εi) components were calculated based on the following equation:

where gi0 and gi are the length of the g-vectors in the unloaded and loaded cases, respectively. For each load level, the corresponding g-vectors were identified and compared with the initial strain-free condition. Details of the strain calculation process are presented in Alshibli et al. (2013). Since all strain tensor components are obtained from the diffraction analysis, the grain stress (σi) could be derived using the general elastic constitutive relationship. The fourth-rank stiffness tensor, which relates strain to stress can be contracted to a six-by-six matrix in the Voigt contraction notation as follows:

where cij is the elastic stiffness tensor in contracted form. The anisotropic elastic structure of the quartz was taken into account while inferring stresses from the grain averaged strain tensors, and the elastic constants of quartz were obtained from Heyliger et al. [2003]. The stress-strain relationships of the normal stress components of top particles in Tests 1, 2, and 3 are depicted in Figure 7. Also, Figure 8 shows the normal stress component in the loading direction (σzz) of all silica sand particles up to the fracture of one of the particles in the sand column. A nearly linear stress-strain relationship is evident in all sand particles under 1D loading as expected. The variation between components stems from several factors including particle motion, or interactions between particle and boundary conditions. Overall, the results show a very consistent elastic behavior in the direction of loading.
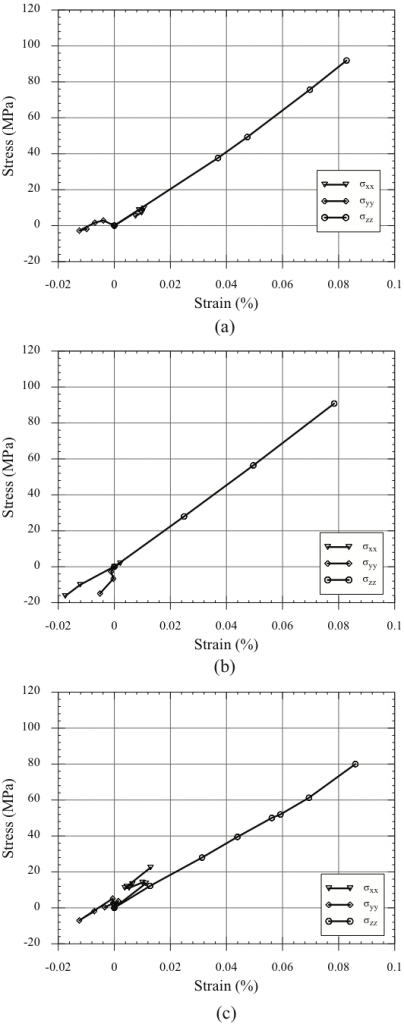
relationships for the normal stress components of the top sand particles in (a)
Test 1; (b) Test 2; and (c) Test 3.

ACKNOWLEDGMENTS
This material is based upon work supported by the National Science Foundation (NSF) under Grants No. CMMI-1156436 and CMMI-1362510. The 3DXRD data were collected using the x-ray Operations and Research Beamline 1-ID and SMT scans were collected using the X-ray Operations and Research Beamline Station 13-BMD at the Advanced Photon Source (APS), Argonne National Laboratory (ANL). We thank Dr. Mark Rivers of (APS) for help in performing the SMT scans. We also acknowledge the support of GeoSoilEnviroCARS (Sector 13), which is supported by the National Science Foundation – Earth Sciences (EAR-1128799), and the Department of Energy, Geosciences (DE-FG02-94ER14466). Use of the Advanced Photon Source, an Office of Science User Facility operated for the U.S. Department of Energy (DOE) Office of Science by Argonne National Laboratory, was supported by the U.S. DOE under Contract No. DE-AC02-06CH11357.
Some of the Related Publications:
- Amirrahmat, S., Imseeh, W., Alshibli, K. A., Kenesei, P., Jarrar, Z., and Sharma, H. (2020). “3D Experimental Measurements of Evolution of Force Chains in Silica Sand”, ASCE Journal of Geotechnical & Geoenvironmental Engineering, Vol. 146, No. 5 (May), https://doi.org/10.1061/(ASCE)GT.1943-5606.0002241
- Cil, M. B. and Alshibli, K. A., Kenesei, P. (2017). “3D Experimental Measurement of Lattice Strain and Fracture Behavior of Sand Particles Using Synchrotron X-ray Diffraction and Tomography”, ASCE Journal of Geotechnical & Geoenvironmental Engineering, Vol. 143, No. 9,DOI: http://ascelibrary.org/doi/10.1061/%28ASCE%29GT.1943-5606.0001737, ‘Download the paper‘
- Cil, M. B. and Alshibli, K. A., Kenesei, P., and Lienert, U. (2014) “Combined High-Energy Synchrotron X-Ray Diffraction and Computed Tomography to Characterize Constitutive Behavior of Silica Sand”, Nuclear Instruments and Methods in Physics Research Section B: Beam Interactions with Materials and Atoms, Vol. 324, pp. 11-16. http://dx.doi.org/10.1016/j.nimb.2013.08.043
- Alshibli, K. A., Cil, M. B., Kenesei, P., and Lienert, U. (2013) “Strain Tensor Determination of Compressed Individual Silica Sand Particles Using High-Energy Synchrotron Diffraction”, Granular Matter, http://link.springer.com/article/10.1007/s10035-013-0424-x